Other Report Sections
PPE Reporting's Other Report sections include:
- All Procedures Analysis
- Payer Mix Analysis
- Principal Procedure Analysis
- Summary Analysis
- Top DRG Analysis
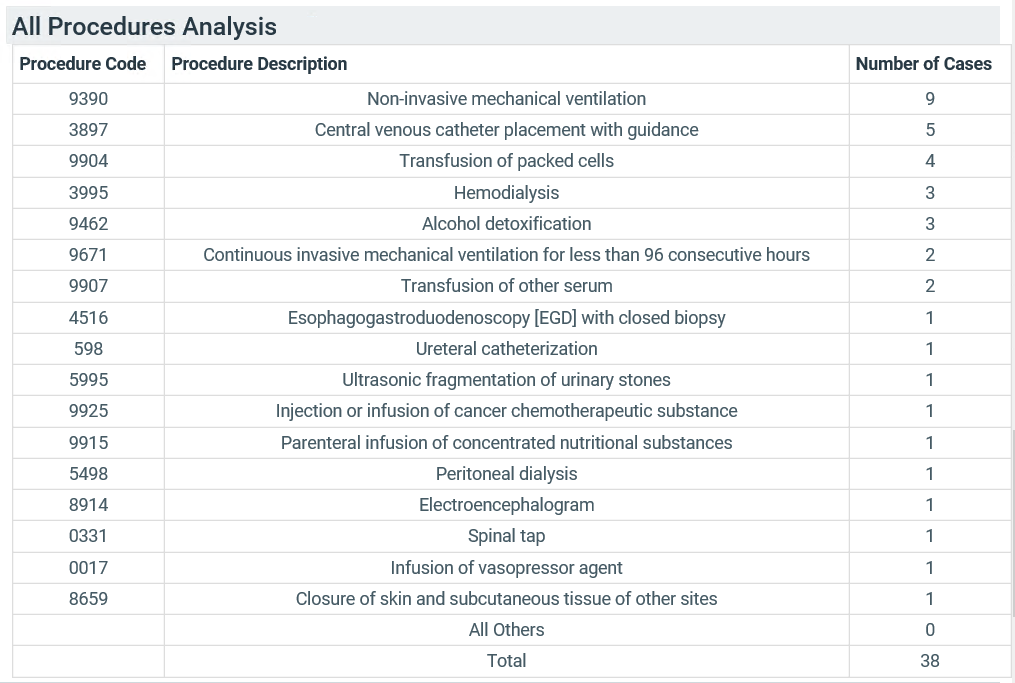
All Procedures Analysis
The All Procedures Analysis section lists the top 20 procedures performed by the Report Physician. Note that this section works similarly to the Top Principal Procedures section, but lists all procedures (not just Principal Procedures). This allows you to more easily obtain physician procedure counts for tracking and reporting.
- When you add the section to your Report tab, there are no customization options.

- When viewing the report, you will see the top 20 Procedure Codes, Procedure Descriptions, and Number of Cases with each Procedure Code.
| Column | Description |
|---|---|
| Procedure Code | Numerical ICD Procedure Code from the ICD-9, ICD-10, HCPCS or CPT standard codes |
| Procedure Description | Detailed description of the procedure; these codes come from the ICD-9, ICD-10, HCPCS or CPT procedure code standard |
| Number of Cases | Number of encounter with the particular procedure code associated with the Report Physician during the report period |
Payer Mix Analysis
The Payer Mix Analysis section lists the top 20 payers used by the physician's patients during the report period, including the number and percentage of encounters for each payer.
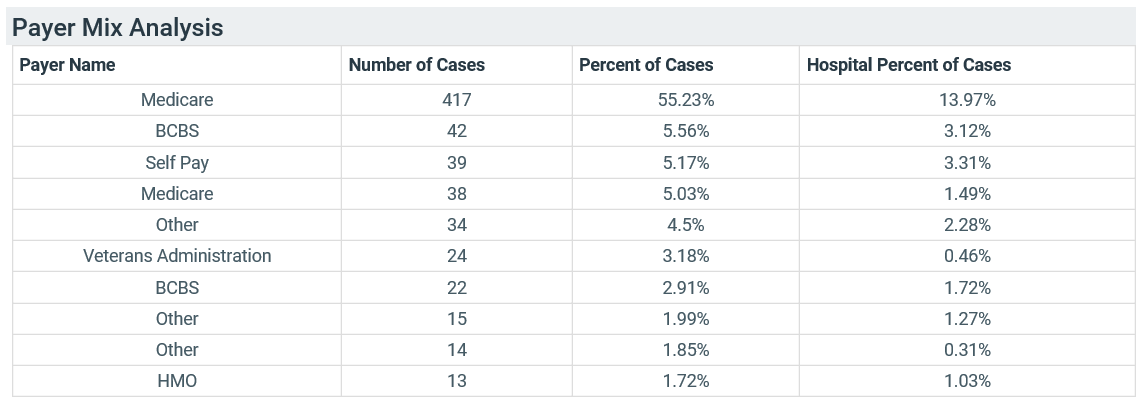
The 21st row shows the number of encounters for all other payers, and the last row shows the totals for each column.
| Column | Description |
|---|---|
| Payer Name | Name of the paying organization |
| Number of Cases | Number of the Report Physician's encounters that organization paid for |
| Percent of Cases | Percent of the Report Physician's encounters using that payer |
| Hospital Percent of Cases | Hospital-wide percent of encounters using that payer |
Principal Procedure Analysis
The Principal Procedure Analysis Section lists the top 20 principal procedures performed among the physician’s patients.
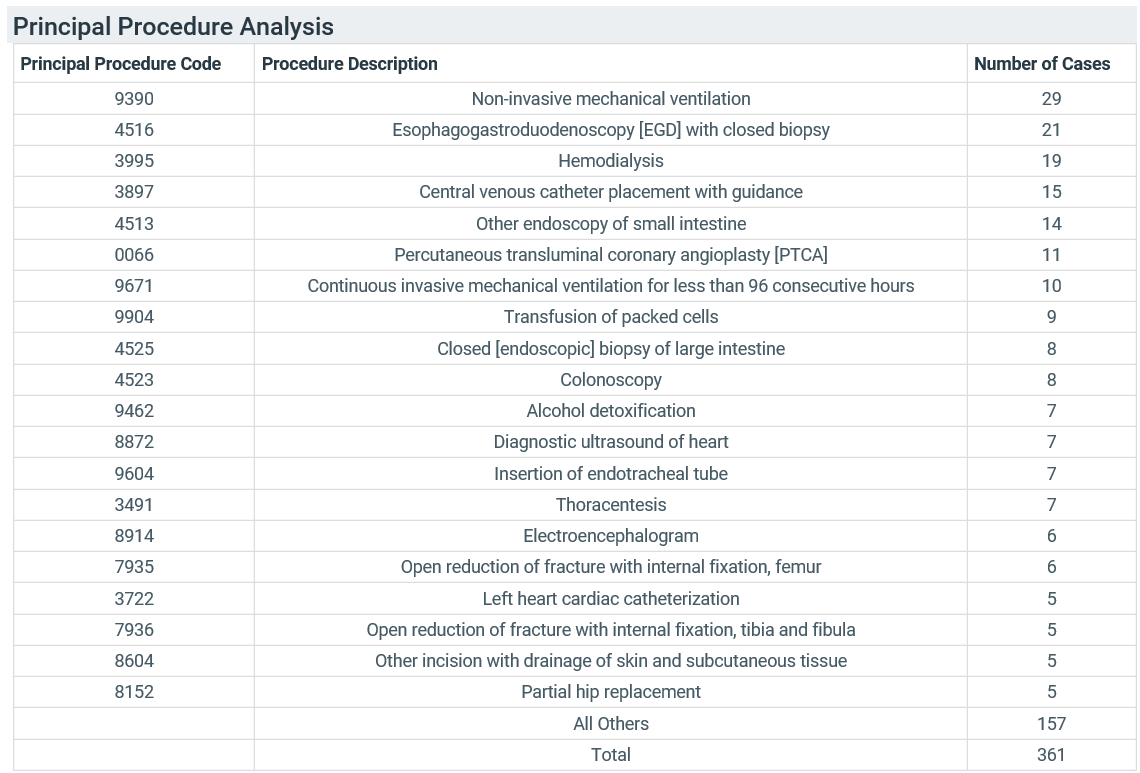
The first 20 entries in the table are the top 20 procedures that the physician performed during the report period. The 21st row includes all other procedures, and the last row shows the total number of encounters that the physician saw during the report period.
| Column | Description |
|---|---|
| Principal Procedure Code | Numerical ICD Procedure Code from the ICD-9, ICD-10, HCPCS or CPT standard codes |
| Procedure Description | Detailed description of the procedure; these codes come from the ICD-9, ICD-10, HCPCS or CPT procedure code standard |
| Number of Cases | Number of encounter with the particular principal procedure code associated with the Report Physician during the report period |
Summary Analysis
The Summary Analysis Section provides a summary of several different measures, including CMI, Average LOS, Percent ICU, Average Charges, Readmissions, and Mortality Rate.
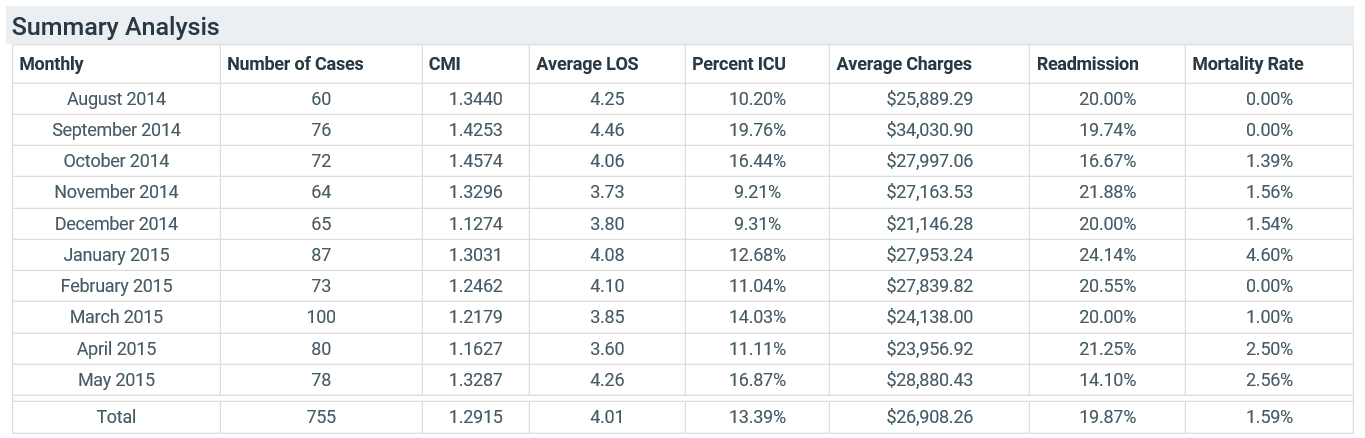
This section gives a broad summary of the physician’s monthly (or quarterly) performance, and is helpful for identifying trends or major changes in performance.
| Column | Description |
|---|---|
| Monthly (or Quarterly) | Lists the month (or quarter) for the data in the row |
| Number of Cases | Number of encounters the Report Physician saw during the month/quarter |
| CMI | Average Case Mix Index for the encounters discharged during the month/quarter |
| Average LOS | Average Length of Stay for the encounters discharged during the month/quarter |
| Percent ICU | Percentage of ICU days, calculated as: (total number of ICU days) divided by (total LOS days) |
| Average Charges | Average charges per encounter discharged during the month/quarter |
| Readmission | 30-day forward-looking patient readmission rate for discharges during the month/quarter |
| Mortality Rate | Percent of patients discharged expired divided by total discharges during the month/quarter |
Top DRG Analysis
The Top DRGs Analysis by APR-DRG/MS-DRG section lists the top 20 observed DRGs among the physician’s patients. The section may list either APR-DRGs or MS-DRGs.
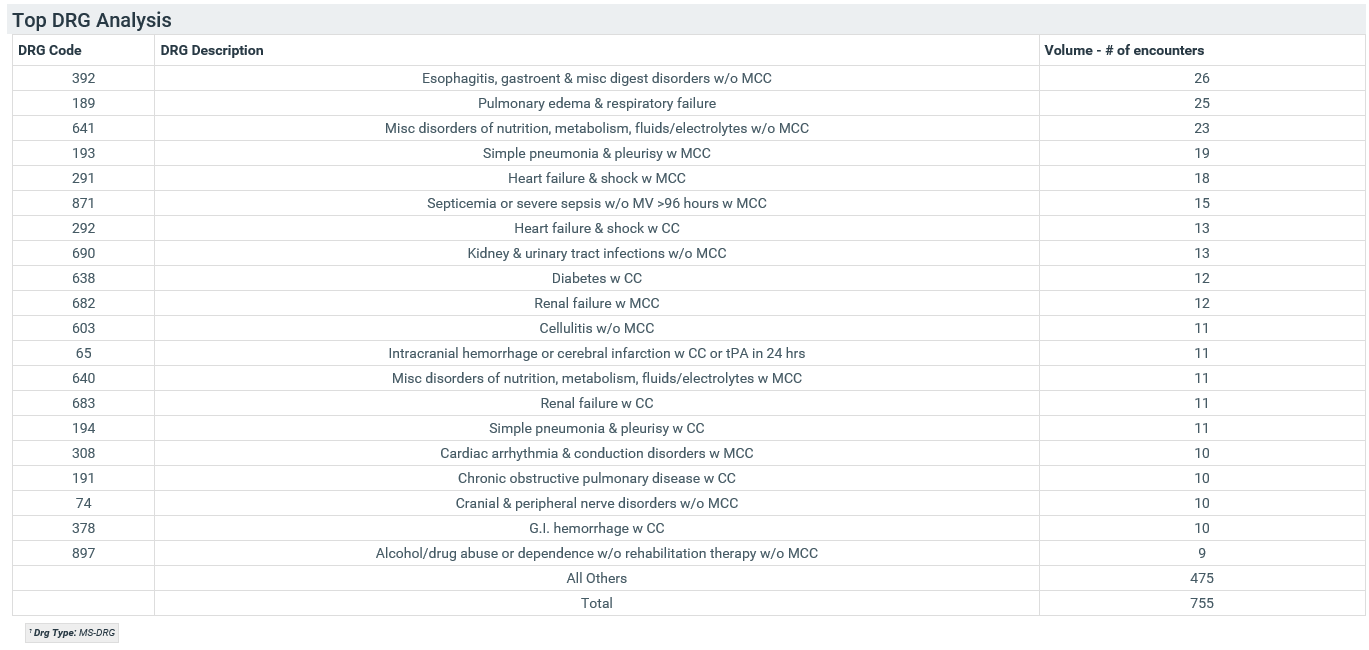
The first 20 entries in the table are the top 20 DRGs that the physician saw during the report period. The 21st row shows the number of encounters for all other DRGs, and the last row shows the total number of encounters that the physician saw during the report period.
| Column | Description |
|---|---|
| DRG Code | Numerical DRG code; APR-DRG codes come from 3M specifications, and MS-DRG codes come from CMS specifications |
| DRG Description | Detailed description of the DRG Code; APR-DRG code descriptions come from 3M specifications, and MS-DRG code descriptions come from CMS specifications |
| Volume - # of Encounters | Number of encounters with the particular DRG associated with the Report Physician and time period |